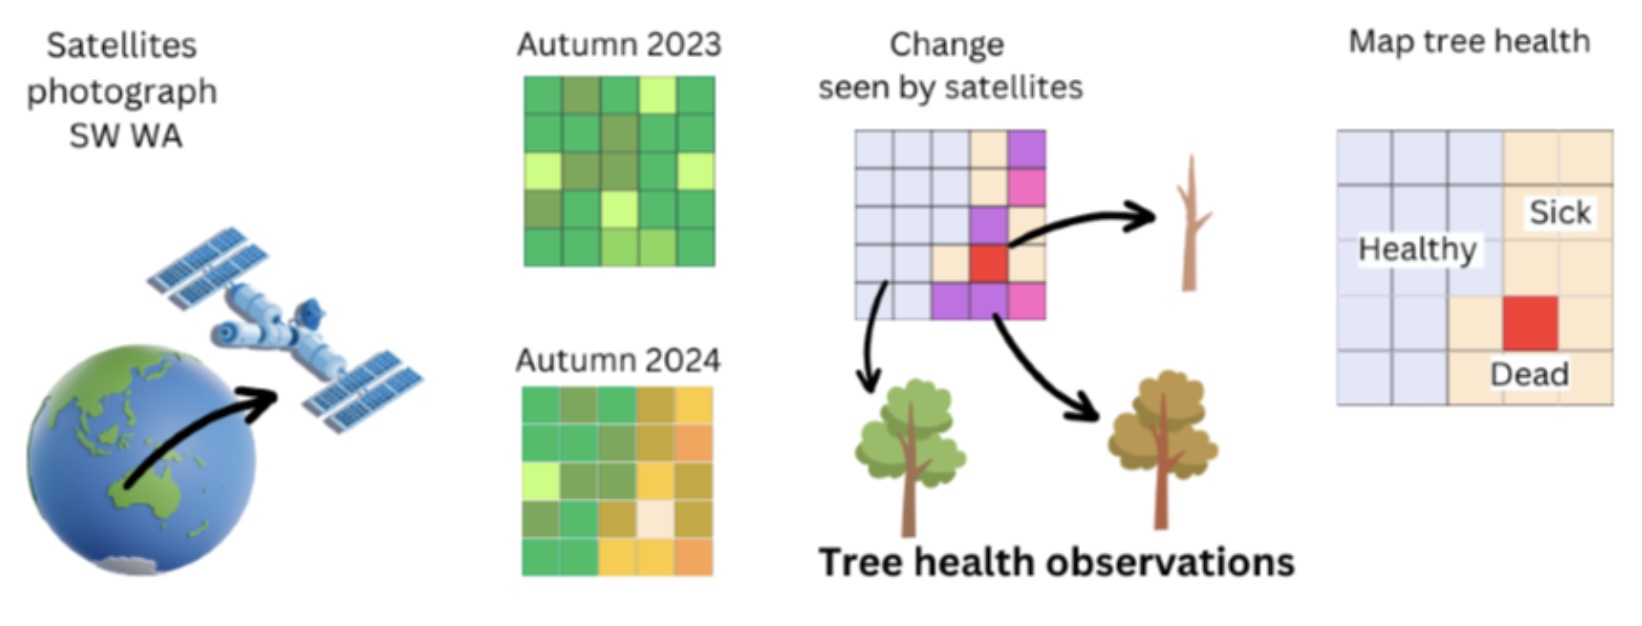
Google translate for satellite images
The information captured by the community via the tree death form is like “Google Translate” - for satellites. It allows us to convert what satellites can see to what we care about - tree health.

How does tree health look to a satellite?
Satellites looking at Southwest Western Australia can measure how much light of different wavelengths is shining out into space. Some of these wavelengths are linked to the things that healthy trees do – like photosynthesis, having a dense canopy, or having a healthy amount of water in their leaves. These wavelengths are often those that lie between red visible light, and infra-red light. They are called the “red edge.”
If drought is making trees sick, or if trees have died, then there should be less light in the near red edge now than at the same place and season in the past.
What does it mean?
A satellite can detect change in how much light there is in these wavelengths. We expect that the bigger the change in these wavelengths, the more damaged the trees are. But to interpret these changes correctly, we also need to know how they are linked to the physical condition of the trees. This is why we need eyes on the ground. By matching the canopy condition ratings from the app with changes seen by satellites, we can translate the satellite data into a map of tree condition.
How will this help?
By mapping tree condition, we can find out what it is that trees that survived the summer have in common with each other. We can also find out whether trees that died have similarities to each other. These similarities might include the tree species or age, whether they are street trees or trees in the bush, whether they are growing near other plants or over hard surfaces, if they are in places with deeper or shallower groundwater.
We hope that there will be clear patterns that predict tree health, because if there are, we can use those patterns to help design management strategies, revegetation, and planting approaches, and make plans to help protect our trees during hot, dry summers.